*** NOTE ***
The Journal online has become part of Concordia University NOW, your source for the latest university news and upcoming events. This site will no longer be updated. Visit the NOW website to read the Journal online and more.

January 28, 2010 | Vol. 5, No. 9
By Russ Cooper
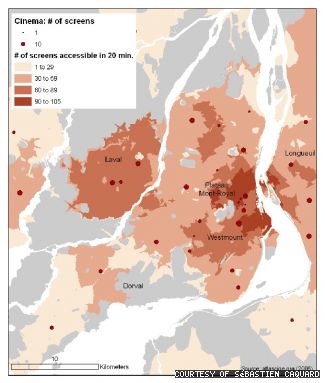
Some parts of the Plateau have the highest concentration of cinemas in the country. From these areas of the borough, you can reach up to 105 screens within roughly 20 minutes travel time.
Its not the destination, its the journey. Geography, planning and environment professor Sébastien Caquard might understand this proverb better than most.
His current research examines how new forms of maps and geovisualization can help us better understand social and environmental issues related to places. In a nutshell, instead of just using maps to explain the best route from A to B, Caquard is experimenting with creative ways to illustrate whats between A and B.
What you see on a normal map is just a fraction of the reality of any particular place, he says. You dont see populations, culture, or things like air quality and pollution.
Originally from Frances Massif Central region, Caquard started at Concordia as a part-time professor in 2007, becoming an assistant professor last summer. Hes also currently a featured invited researcher at UdeM.
In the past, hes been involved in the development of several exploratory online atlases such as the Atlas of Risks of Homelessness in Canada and the Atlas of Indigenous Knowledge in the Great Lake Region. He is currently developing an online Atlas of Canadian Cinema.
Hes particularly interested in combining the aural and visual storytelling qualities of cinema with cartography. His momentum in cinema stems from a SSHRC-funded project entitled Geographie du Cinema Canadien: Une approche cybercartographique. For this project, he is currently working with a team of students examining 46 made-in-Canada movies produced from 2006 to 09 to tabulate which worldwide locations are most depicted. Using 30 different criteria, hes analyzing the data to find out what Canadian-made cinema tells us out our collective view of world geography.
Hes found that Quebec represents 43% of the locations portrayed. Ontario (19%), Nunavut (6%), and BC and Alberta combined (3%) round out the rest of the nation, while Asia and Africa represent 12% and 8% respectively.
Quebecs film predominance is explained by both the importance of Quebec film industry (about 50% of the Canadian production) and by a tendency in Quebec cinéma to focus on its province, and more specifically on Montréal, Caquard says.
In a previous part of this project, Caquard examined the roughly 700 movie cinemas in Canada and the social conditions of their locations to determine what factors limit Canadians access to the culture provided by movies.
Using a Geographical Information System (GIS), Caquard and his colleagues found that across Canada there is no sociodemographic segregation in terms of movie theaters offer. The study found access is only influenced by population density of a given area; income bracket, race, etc. play no part in where movie theatres are located. In other words, those living in rural areas have to travel further to see a flick. Conversely, living in a city, theres more access to cinematic choice.
As to how to tell these stories using new creative cartographic methods, its still being discussed. But one method hes considering is augmented reality a live view of a physical real-world environment whose elements are merged with (or augmented by) virtual computer-generated imagery. Think Google Street View on a mobile device that instantaneously gives you historical or cultural info about anything you point it at.
Caquard will be presenting at the Conference of the Association of American Geographers in Washington, D.C. in April.

Page Title: Maps tell us more than we think, says geography prof - Concordia University - Montreal, Quebec, Canada
Page URL:http://cjournal.concordia.ca/archives/20100128/maps_tell_us_more_than_we_th...p
Date Printed: Thu April 18, 2024